
What is weather?
Our daily experience relates to the state of the weather. It describes meteorological parameters such as temperature, pressure, humidity, wind, clouds, precipitation, sand storms, etc., in a given place and in a short period of time. For example, in Lisbon, it can rain in the morning and be sunny in the afternoon. Thus, it is fickle and can vary substantially. Weather and climate are different concepts, mainly because the former analyses shorter periods of time regarding meteorological parameters.

Photo: Flickr/Félix Bernet
References:
Instituto Português do Mar e da Atmosfera. (2015). Clima. Accessed 30 March 2015 at: http://www.ipma.pt/pt/enciclopedia/clima/index.html
References:
Instituto Português do Mar e da Atmosfera. (2015). Clima. Accessed 30 March 2015 at: http://www.ipma.pt/pt/enciclopedia/clima/index.html
WHAT IS CLIMATE?
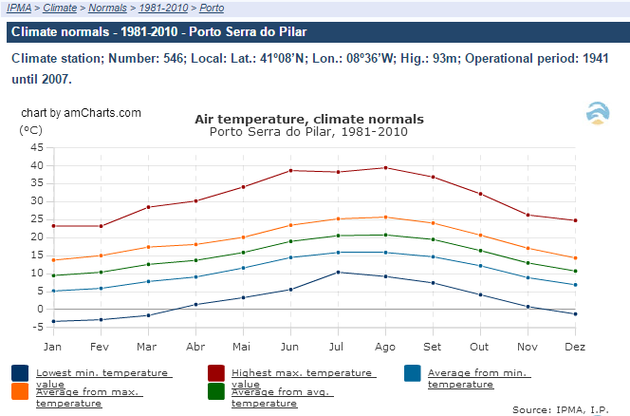
The concept of climate describes the prevailing weather conditions such as temperature, pressure, humidity, wind, clouds, precipitation, sand storms, etc. at a specific location and for a prolonged period of time. The climate is often defined as the average weather or as a summary of the weather; however, strictly speaking, it consists of a statistical description of several elements (atmospheric, terrestrial and oceanic) during a prolonged period of time. To characterise the climate of a given region, the World Meteorological Organization uses data collected over 30 years, although the period considered could range from months to millions of years. For example, you can calculate an average of temperatures recorded in Lisbon, during the decades from 1980 to 2010, thus contributing to the characterization of the climate of the region. Weather and climate study the same meteorological parameters, varying essentially in the period of time analysed.
Source: IPMA
References:
Cubasch, U., Wuebbles, D., Chen, D., Facchini, M.C., Frame, D., Mahowald, N., & Winther, J.-G. (2013). Introduction. In: Climate Change 2013: The Physical Science Basis. Contribution of Working Group I to the Fifth Assessment Report of the Intergovernmental Panel on Climate Change [Stocker, T.F., D. Qin, G.-K. Plattner, M. Tignor, S.K. Allen, J. Boschung, A. Nauels, Y. Xia, V. Bex and P.M. Midgley (eds.)]. Cambridge and New York: Cambridge University Press. Accessed at: https://www.ipcc.ch/pdf/assessment-report/ar5/wg1/WG1AR5_Chapter01_FINAL.pdf
Instituto Português do Mar e da Atmosfera. (2015). Clima. Accessed 30 March 2015 at: http://www.ipma.pt/pt/enciclopedia/clima/index.html
World Meteorological Organization. (s.d.). Statistical depictions of climate. Accessed 30 March 2015 at: https://www.wmo.int/pages/themes/climate/statistical_depictions_of_climate.php
what is greenhouse effect?
Since the global temperature on our planet has remained relatively constant for several centuries, we can infer that the amount of solar energy reaching the planet must be practically in balance with the energy that it emits into space. Hence, the planet Earth lies virtually in radiative balance, as we will explain.
Of the solar radiation with short wavelengths reaching the atmosphere, about 30% is reflected back into space, 20% is absorbed by the atmosphere and 50% is absorbed by the Earth's surface, either by the soil or by the oceans (see Figure 1).
Of the solar radiation with short wavelengths reaching the atmosphere, about 30% is reflected back into space, 20% is absorbed by the atmosphere and 50% is absorbed by the Earth's surface, either by the soil or by the oceans (see Figure 1).
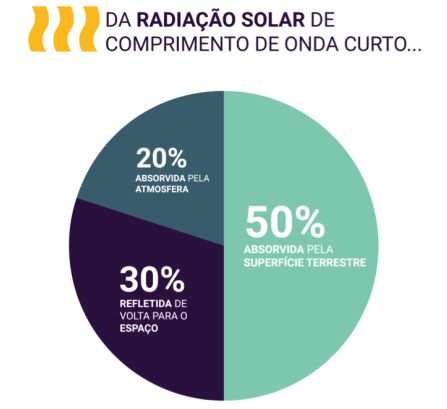
Figure 1: Pie chart representing the proportions of radiation absorbed by the atmosphere, absorbed by the Earth's surface and reflected into space; Of the short wavelength solar radiation…
20% is absorbed by the atmosphere
30% is reflected back to space
50% is absorbed by the Earth’s surface
As in any other body, most of the energy absorbed by the Earth system is re-emitted in the form of infrared (IR) radiation, that is, with a long wavelength. This energy is again absorbed by certain components of the atmosphere, as water vapor (H2O) and carbon dioxide (CO2), which re-emit IR radiation in all directions, causing a warming of the atmosphere’s lower layers and of the terrestrial surface, by a phenomenon called greenhouse effect (see Figure 2).

Figure 2: Idealized model of the natural greenhouse effect. The reflection of solar energy by the atmosphere and land surface is represented by yellow arrows. The emission of solar energy absorbed in the form of infrared (IR) radiation by the Earth’s surface and by certain components of the atmosphere is represented by red arrows. Part of the IR radiation escapes into space and part is reabsorbed again. It is considered that the intensity of the greenhouse effect was at natural levels in the pre-industrial period, that is, before human intervention on a large scale.
The greenhouse designation was established as an analogy to what happens in a greenhouse, where the plastic or glass is traversed by short wavelength solar radiation, retaining, nevertheless, the long wavelength radiation emitted by soil. Thus, the temperature inside the greenhouse becomes higher when compared to its surrounding environment.
The current global average temperature, about 15°C, enables the existence of water in a liquid state, as well as Life, exists due to the natural greenhouse effect (see Figure 3B). If there were no greenhouse gases in the atmosphere, the estimated global average temperature would be much lower: about -18°C (see Figure 3A).
The unprecedented emission of gases with greenhouse effect due to human activities over the past 200 years, particularly carbon dioxide (CO2), methane (CH4) and nitrous oxide (N2O) is a major cause of the intensification of the natural greenhouse effect (see Figure 3C). This process results, and will continue to do so in the future, in global warming and in other long-lasting climate changes, with diverse impacts in different regions of the world, such as:
Ø the frequency and intensity of heat waves have increased since the mid-twentieth century, particularly in much of Europe, Asia and Australia, resulting in increased human mortality and disturbances in natural ecosystems;
Ø in the mid-latitude land areas of the Northern Hemisphere precipitation has increased since 1901, resulting in floods with greater flow and frequency;
Ø a significant reduction of the masses of snow and ice is being registered, particularly in the Arctic, Greenland and Antarctica, disrupting natural ecosystems and contributing to the global rise in average sea level.
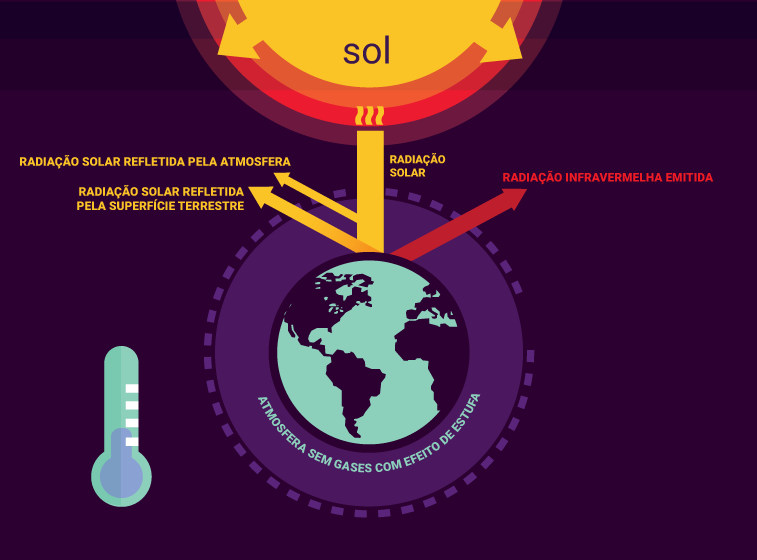
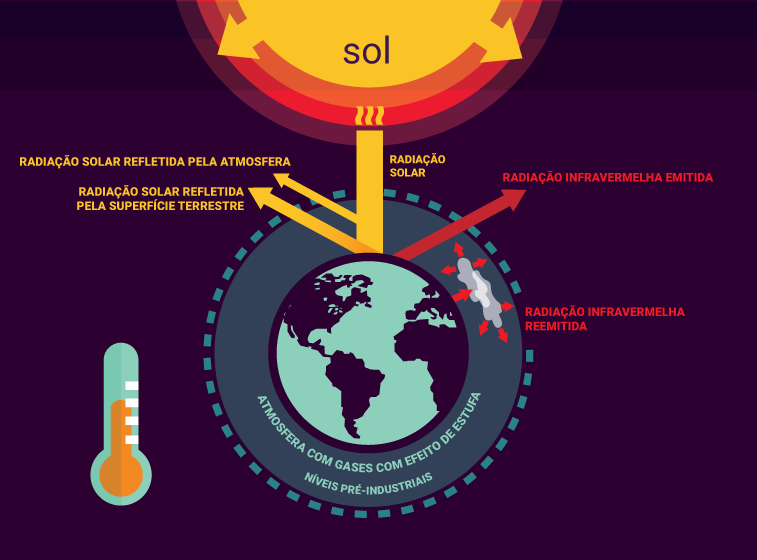

Figure 3: Comparison of the global mean temperature in three idealised situations: (A) situation in which the atmosphere of the Earth does not have greenhouse gases. In this case the infrared (IR) radiation escapes easily into the space and the global mean temperature is about -18°C; (B) Situation in which the Earth's atmosphere has pre-industrial levels of greenhouse gases. In this situation, part of the IR radiation is absorbed by those greenhouse gases and global mean temperature is about 15°C; (C) Situation in which the Earth's atmosphere has greenhouse gases at levels above the pre-industrial ones. In this situation, a greater portion of the IR radiation is absorbed by those greenhouse gases and the global mean temperature expected by the end of the 21st century, according to the Intergovernmental Panel on Climate Change, can range from about 15.3ºC and 19.8ºC.
References:
Andrade, J.A. (2011). Energia no Sistema Climático (Apontamentos para aulas de Microclimatologia dos Habitats). Évora: Dep. de Geociências da Universidade de Évora. Accessed at: http://dspace.uevora.pt/rdpc/bitstream/10174/8382/1/Energia%20no%20Sistema%20Clim%C3%A1tico.pdf
Cubasch, U., Wuebbles, D., Chen, D., Facchini, M.C., Frame, D., Mahowald, N., & Winther, J.-G. (2013). Introduction. In: Climate Change 2013: The Physical Science Basis. Contribution of Working Group I to the Fifth Assessment Report of the Intergovernmental Panel on Climate Change [Stocker, T.F., D. Qin, G.-K. Plattner, M. Tignor, S.K. Allen, J. Boschung, A. Nauels, Y. Xia, V. Bex and P.M. Midgley (eds.)].Cambridge and New York: Cambridge University Press. Accessed at: https://www.ipcc.ch/pdf/assessment-report/ar5/wg1/WG1AR5_Chapter01_FINAL.pdf
Hartmann, D.L., Tank, A., Rusticucci, M., Alexander, L.V., Brönnimann, S., Charabi, Y., Dentener, F.J., Dlugokencky, E.J., Easterling, D.R., Kaplan, A., Soden, B.J., Thorne, P.W., Wild, M. & Zhai, P.M. (2013). Observations: Atmosphere and Surface. In: Climate Change 2013: The Physical Science Basis. Contribution of Working Group I to the Fifth Assessment Report of the Intergovernmental Panel on Climate Change [Stocker, T.F., D. Qin, G.-K. Plattner, M. Tignor, S.K. Allen, J. Boschung, A. Nauels, Y. Xia, V. Bex and P.M. Midgley (eds.)].Cambridge and New York: Cambridge University Press. Accessed at: https://www.ipcc.ch/pdf/assessment-report/ar5/wg1/WG1AR5_Chapter02_FINAL.pdf
IPMA - Instituto Português do Mar e da Atmosfera. (2015). FAQ's – Climatologia. O que é o "Efeito de estufa"? Accessed 30 March 2015 at: http://www.ipma.pt/pt/educativa/faq/climatologia/faqdetail.html?f=/pt/educativa/faq/climatologia/faq_0006.html
Le Treut, H., Somerville, R., Cubasch, U., Ding, Y., Mauritzen, C., Mokssit, A., Peterson, T., & Prather, M. (2007). Historical Overview of Climate Change. In: Climate Change 2007: The Physical Science Basis. Contribution of Working Group I to the Fourth Assessment Report of the Intergovernmental Panel on Climate Change [Solomon, S., D. Qin, M. Manning, Z. Chen, M. Marquis, K.B. Averyt, M. Tignor and H.L. Miller (eds.)].Cambridge and New York: Cambridge University Press. Accessed at: http://www.ipcc.ch/pdf/assessment-report/ar4/wg1/ar4-wg1-chapter1.pdf
Santos, F.D. (2007). A Física das Alterações Climáticas. Gazeta de Física, 30(1): 48-57. Accessed at: http://nautilus.fis.uc.pt/gazeta/revistas/30_1/vol30_fasc1_Art06.pdf
WHAT IS RADIANT ENERGY?
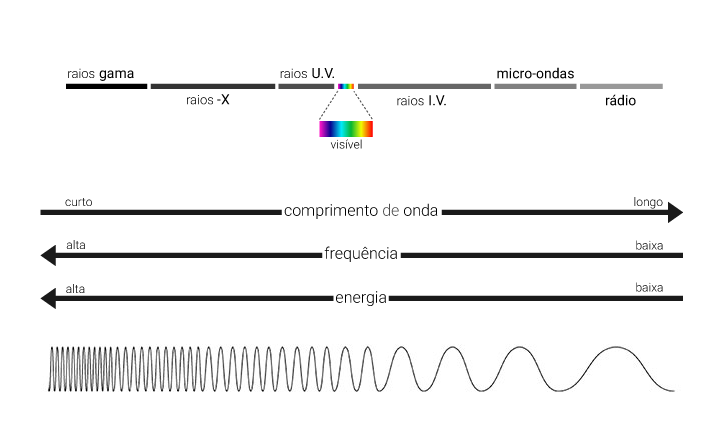
Radiant energy or radiation has an electromagnetic nature, that is, it propagates itself through an oscillation of its electric and magnetic fields. Thus, it constitutes a wave with a given frequency, wavelength, speed, etc. and does not need the support of a medium, such as water or air, to propagate. For this reason the energy emitted by the Sun can be spread in the vacuum of Space and hit the Earth. According to its properties, electromagnetic radiation can be grouped into certain classes, as evidenced by the following figure, which represents the electromagnetic radiation spectrum.
Source: NASA/Johnson Space Flight Center/Image Science & Analysis Laboratory e final gather
The Sun emits radiant energy, but this energy does not cover all areas of the electromagnetic spectrum. This energy varies between the ultraviolet (UV) and the infrared (IR) regions, and approximately 50% of the solar energy is emitted in the visible part of the spectrum. Visible radiation is hardly absorbed by the atmosphere; nevertheless, the UV and the IR radiation are partially absorbed, respectively, by the ozone (O3) and water vapor (H2O) and other atmospheric gases.
References:
Andrade, J.A. (2011). Energia no Sistema Climático (Apontamentos para aulas de Microclimatologia dos Habitats). Évora: Dep. de Geociências da Universidade de Évora. Accessed at: http://dspace.uevora.pt/rdpc/bitstream/10174/8382/1/Energia%20no%20Sistema%20Clim%C3%A1tico.pdf
Cubasch, U., Wuebbles, D., Chen, D., Facchini, M.C., Frame, D., Mahowald, N., & Winther, J.-G. (2013): Introduction. In: Climate Change 2013: The Physical Science Basis. Contribution of Working Group I to the Fifth Assessment Report of the Intergovernmental Panel on Climate Change [Stocker, T.F., D. Qin, G.-K. Plattner, M. Tignor, S.K. Allen, J. Boschung, A. Nauels, Y. Xia, V. Bex and P.M. Midgley (eds.)].Cambridge and New York: Cambridge University Press. Accessed at: https://www.ipcc.ch/pdf/assessment-report/ar5/wg1/WG1AR5_Chapter01_FINAL.pdf
Portal da sabedoria. (s.d.) Radiação eletromagnética [ficheiro vídeo]. Accessed at: https://portaldasabedoria.pt/ensino-secundario-medio/fisica/termodinamica/radiacao-eletromagnetica
what are aerosols?
Aerosols are tiny solid or liquid particles suspended in the atmosphere, which generally have a reflective effect on solar radiation. When in great number in the atmosphere, they reflect more radiation and the global average temperature drops. Large volcanic eruptions and fossil fuels burning are examples of phenomena that release large amounts of aerosols into the atmosphere and, thus, contribute to cool the planet. Strong precipitation is an example of a phenomenona that decreases the amount of aerosols suspended in the atmosphere and, therefore, heats the planet.
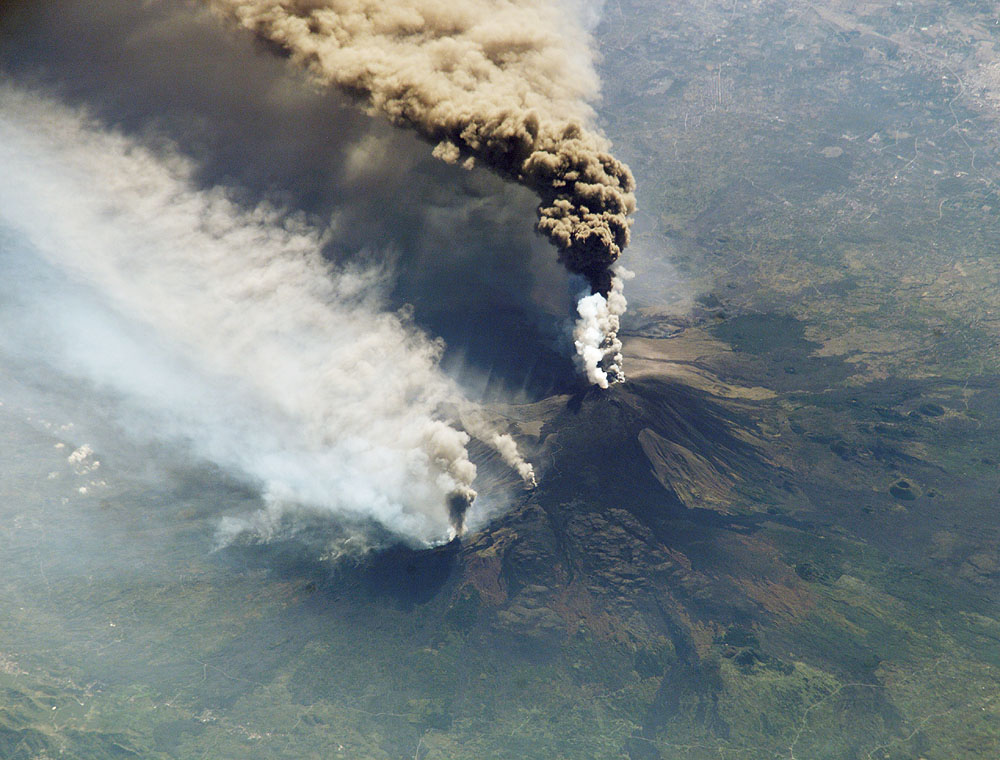
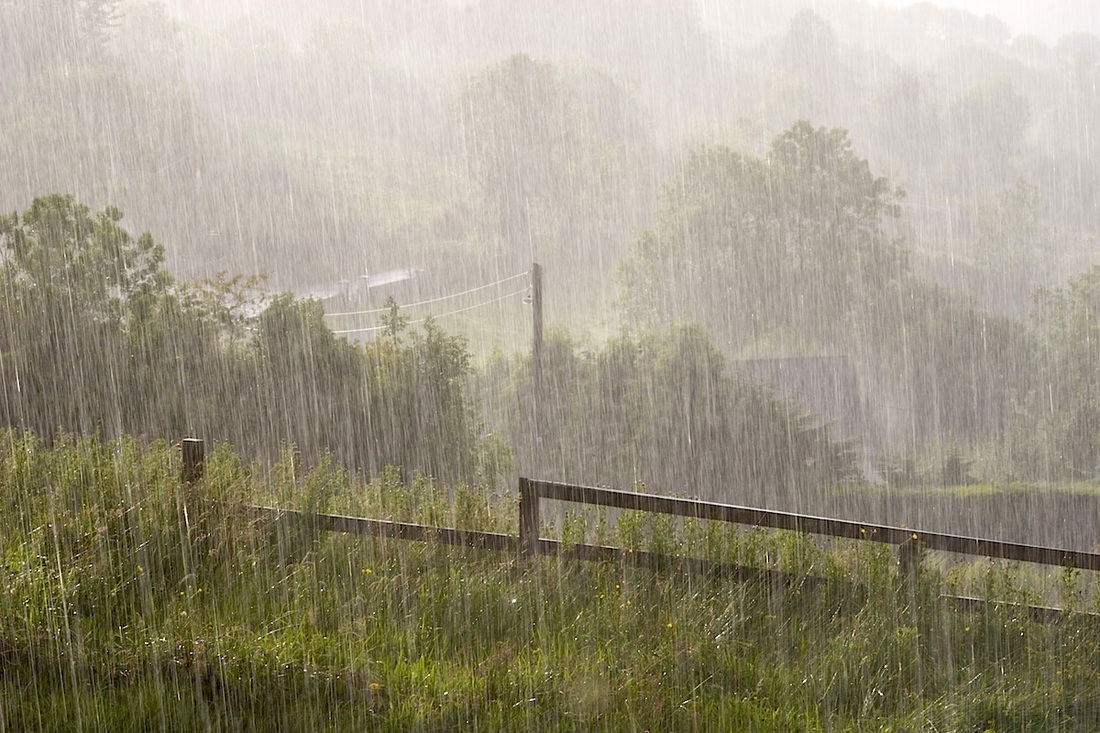
Figure: Representation of the electromagnetic spectrum and comparison of the wavelength, frequency and energy of different radiation (adapted from figure at http://imagine.gsfc.nasa.gov/science/toolbox/emspectrum1.html); “UV rays” refers to ultraviolet radiation and “IR rays” refers to infrared radiation.
With regard to the burning of fossil fuels, it is important to stress that, despite their contribution to the cooling of the Earth by increasing the amount of radiation reflective aerosols in the atmosphere, this input is very small. Firstly, the aerosols emitted in this way are easily drawn into the soil by rain, so its effect occurs only in a short period of time. Moreover, the burning of fossil fuels also releases large quantities of carbon dioxide (CO2) to the atmosphere, a major greenhouse gas. Although variable, the lifetime of CO2 in the atmosphere can exceed a hundred years, making its warming effect upon our planet much higher.
References:
Cubasch, U., Wuebbles, D., Chen, D., Facchini, M.C., Frame, D., Mahowald, N., & Winther, J.-G. (2013): Introduction. In: Climate Change 2013: The Physical Science Basis. Contribution of Working Group I to the Fifth Assessment Report of the Intergovernmental Panel on Climate Change [Stocker, T.F., D. Qin, G.-K. Plattner, M. Tignor, S.K. Allen, J. Boschung, A. Nauels, Y. Xia, V. Bex and P.M. Midgley (eds.)].Cambridge and New York: Cambridge University Press. Accessed at: https://www.ipcc.ch/pdf/assessment-report/ar5/wg1/WG1AR5_Chapter01_FINAL.pdf
Solomon, S., Qin, D., Manning, M., Alley, R.B., Berntsen, T., Bindoff, N.L., Chen, Z., Chidthaisong, A., Gregory, J.M., Hegerl, G.C., Heimann, M., Hewitson, B., Hoskins, B.J., Joos, F., Jouzel, J., Kattsov, V., Lohmann, U., Matsuno, T., Molina, M., Nicholls, N., Overpeck, J., Raga, G., Ramaswamy, V., Ren, J., Rusticucci, M., Somerville, R., Stocker, T.F., Whetton, P., Wood, R.A., & Wratt, D. (2007). Technical Summary. In: Climate Change 2007: The Physical Science Basis. Contribution of Working Group I to the Fourth Assessment Report of the Intergovernmental Panel on Climate Change [Solomon, S., D. Qin, M. Manning, Z. Chen, M. Marquis, K.B. Averyt, M. Tignor and H.L. Miller (eds.)].Cambridge and New York: Cambridge University Press. Accessed at: http://www.ipcc.ch/pdf/assessment-report/ar4/wg1/ar4-wg1-ts.pdf
WHAT are greenhouse gases?
The atmosphere is constituted by a mixture of several gases (see figure) whose concentration has not been constant throughout the history of planet Earth. Currently it is estimated that 78% of the atmosphere consists of nitrogen (chemical symbol: N2) and 21% oxygen (chemical symbol: O2) gases which have almost no greenhouse effect. The gases that effectively contribute to the warming of the Earth's surface are in lesser amount in the atmosphere. The two greenhouse gases (GHG) which are considered to be the most important are water vapour (H2O) and carbon dioxide (CO2), followed by methane (CH4), nitrous oxide or dinitrogen oxide (N2O), ozone (O3), chlorofluorocarbons (CFC) and others.
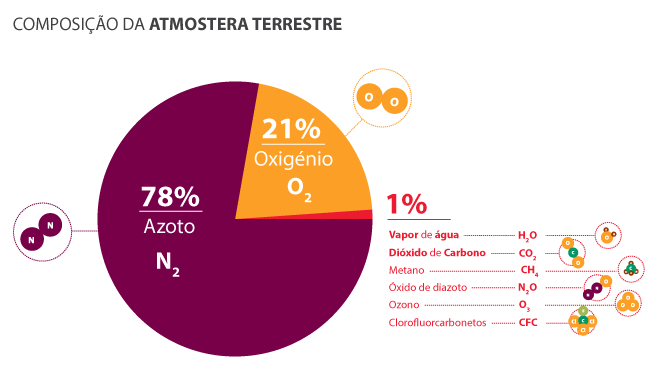
Figure 4: Pie chart showing the composition of the atmosphere.
The concentration of a GHG in the atmosphere results from the balance between its emissions and removals from the atmosphere throughout the history of the Earth. For instance, CO2, a major greenhouse gas, is naturally released into the atmosphere, during volcanic eruptions (among other emission factors). However, this gas is also removed during photosynthesis by plants to produce their organic compounds. Nevertheless, there is evidence that the atmospheric concentration of CO2 has increased over the last 250 years. This increase was mainly due to human activities, also called anthropogenic. In particular, due to the burning of fossil fuels like oil and coal, and changes in land use, including deforestation to create new farmland or housing developments. On the other hand, other greenhouse gases, such as chlorofluorocarbons (CFCs) and hydrochlorofluorocarbons (HCFC) are entirely due to human activities.
Some greenhouse gases have a long life span in the atmosphere, such as CO2, CH4, and N2O, and therefore have a greater influence on climate.
References:
Solomon, S., Qin, D., Manning, M., Alley, R.B., Berntsen, T., Bindoff, N.L., Chen, Z., Chidthaisong, A., Gregory, J.M., Hegerl, G.C., Heimann, M., Hewitson, B., Hoskins, B.J., Joos, F. Jouzel, J., Kattsov, V., Lohmann, U., Matsuno, T., Molina, M., Nicholls, N., Overpeck, J., Raga, G., Ramaswamy, V., Ren, J., Rusticucci, M., Somerville, R., Stocker, T.F., Whetton, P., Wood, R.A., & Wratt, D. (2007). Technical Summary. In: Climate Change 2007: The Physical Science Basis. Contribution of Working Group I to the Fourth Assessment Report of the Intergovernmental Panel on Climate Change [Solomon, S., D. Qin, M. Manning, Z. Chen, M. Marquis, K.B. Averyt, M. Tignor and H.L. Miller (eds.)].Cambridge and New York: Cambridge University Press Acessed at: http://www.ipcc.ch/pdf/assessment-report/ar4/wg1/ar4-wg1-ts.pdf
What would happen if all anthropogenic emissions of greenhouse gases were to cease?
Even if anthropogenic greenhouse gas emissions immediately ceased, the climate system would continue to change until it reached a state of equilibrium. This is due to the slow response of some components of the climate system, such as the atmosphere (due to the long life span of some GHG), and oceans (due to their elevated inertia in the absorption of heat), preventing equilibrium conditions for many centuries.
In the first case, the time during which the GHG persist in the atmosphere ranges from days to thousands of years. For example, methane (CH4 ) has a lifespan of about 10 years and hexafluoroethane (C2F6) persists for 10 thousand years. In the case of carbon dioxide (CO2), removal can occur via multiple processes with different periods, from a few decades to a thousand years (for about 15 to 40% of emitted gas in a given time). Studies that simulate what would happen if, in the unlikely scenario, today GHG emissions were reduced to zero, reveal that concentrations of these gases would not immediately decrease to levels similar to their pre-industrial levels. For example, although CH4 concentrations need only 50 years to return to pre-industrial values, CO2 concentrations would not return to these levels in a relevant time scale for our society.
If GHG concentrations were held constant at current levels, the Earth's surface would continue to warm about 0.6°C during the twenty-first century, compared to 2000 (see area marked in grey in the figure). If greenhouse gas emissions remain at today’s levels, warming levels will prove to be more accentuated than what is currently registered (see red area in the figure). Even if greenhouse gas emissions were zero, as of today, the concentration of gases with a long lifespan in the atmosphere would decrease slowly and we would continue to feel their effect. In this case, after a short period of global warming, mean global temperature would keep reducing at least until 2150 (see blue area in the figure).
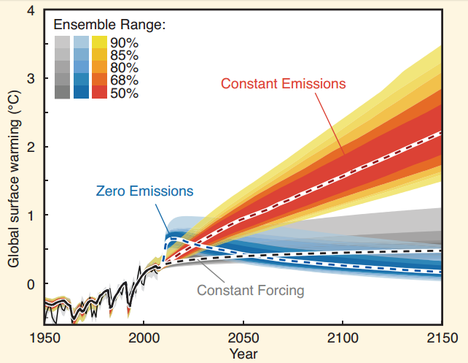
Figure 5: Projections based on the energy balance of the Carbon Cycle Model.
Model for the Assessment of Greenhouse Gas-Induced Climate Change (MAGICC) to constant atmospheric composition (grey marked area), constant GHG emissions (area in red) and zero future emissions of GHG (blue area), from 2010 and showing estimates of uncertainty (Collins et al., 2013, p.1106).
Oceans have a high capacity to absorb heat, but the mixing of water from the surface with the one from deeper layers is limited. Hence, it would take several centuries for all ocean to warm and reach a balance. In addition, they continue with their thermal expansion (i.e., increase in volume due to the increase in temperature), further contributing to a global sea level rise.
References:
Cubasch, U., Wuebbles, D., Chen, D., Facchini, M.C., Frame, D., Mahowald, N., & Winther, J.-G. (2013). Introduction. In: Climate Change 2013: The Physical Science Basis. Contribution of Working Group I to the Fifth Assessment Report of the Intergovernmental Panel on Climate Change [Stocker, T.F., D. Qin, G.-K. Plattner, M. Tignor, S.K. Allen, J. Boschung, A. Nauels, Y. Xia, V. Bex and P.M. Midgley (eds.)]. Cambridge and New York: Cambridge University Press. Accessed: https://www.ipcc.ch/pdf/assessment-report/ar5/wg1/WG1AR5_Chapter01_FINAL.pdf
Collins, M., Knutti, R., Arblaster, J., Dufresne, J.-L., Fichefet, T., Friedlingstein, P., Gao, X., Gutowski, W.J., Johns, T., Krinner, G., Shongwe, M., Tebaldi, C., Weaver, A.J., & Wehner, M. (2013). Long-term Climate Change: Projections, Commitments and Irreversibility. In: Climate Change 2013: The Physical Science Basis. Contribution of Working Group I to the Fifth Assessment Report of the Intergovernmental Panel on Climate Change [Stocker, T.F., D. Qin, G.-K. Plattner, M. Tignor, S.K. Allen, J. Boschung, A. Nauels, Y. Xia, V. Bex and P.M. Midgley (eds.)]. Cambridge and New York: Cambridge University Press. Accessed: http://www.ipcc.ch/pdf/assessment-report/ar5/wg1/WG1AR5_Chapter12_FINAL.pdf
what is the albedo?
Radiation – or radiant energy – falls from the Sun on the surface of planet Earth. The albedo concept refers to the percentage of incident radiant energy that is reflected by the Earth. This reflection is made by some gases, small solid or liquid particles suspended in the atmosphere, clouds, ice / snow, surface waters and soil.

References:
Cubasch, U., Wuebbles, D., Chen, D., Facchini, M.C., Frame, D., Mahowald, N., & Winther, J.-G. (2013). Introduction. In: Climate Change 2013: The Physical Science Basis. Contribution of Working Group I to the Fifth Assessment Report of the Intergovernmental Panel on Climate Change [Stocker, T.F., D. Qin, G.-K. Plattner, M. Tignor, S.K. Allen, J. Boschung, A. Nauels, Y. Xia, V. Bex and P.M. Midgley (eds.)].Cambridge and New York: Cambridge University Press. Acedido de: https://www.ipcc.ch/pdf/assessment-report/ar5/wg1/WG1AR5_Chapter01_FINAL.pdf
Cubasch, U., Wuebbles, D., Chen, D., Facchini, M.C., Frame, D., Mahowald, N., & Winther, J.-G. (2013). Introduction. In: Climate Change 2013: The Physical Science Basis. Contribution of Working Group I to the Fifth Assessment Report of the Intergovernmental Panel on Climate Change [Stocker, T.F., D. Qin, G.-K. Plattner, M. Tignor, S.K. Allen, J. Boschung, A. Nauels, Y. Xia, V. Bex and P.M. Midgley (eds.)].Cambridge and New York: Cambridge University Press. Acedido de: https://www.ipcc.ch/pdf/assessment-report/ar5/wg1/WG1AR5_Chapter01_FINAL.pdf
what is climate change adaptation?
Human interference with the climate system is occurring and climate change presents a set of risks, both for human populations and natural ecosystems. Adaptation helps to deal with the climate impacts that cannot be avoided, thus involving the development of adaptation measures to climate change and its effects.
In human systems, adaptation means reduction or prevention of damage as well as the exploitation of favourable opportunities. For instance, in urban areas with high risk of flooding, warning systems and land use planning are relevant, at the local level, so as to allow a better flow of rainwater. Regarding exploration opportunities created by climate change, winters that seem increasingly mild may allow farmers to cultivate vegetable species in areas where it was previously not possible.
In natural systems, human intervention can facilitate the adaptation to climate change and its effects. For example, some species travel, by themselves, to other regions with more suitable climate. However, the Intergovernmental Panel on Climate Change states with high confidence that climate change together with other stress factors such as over-exploitation or pollution pose several terrestrial and marine species at high risk of extinction, during and after the 21st century. In an attempt to avoid situations of extinction, humans can intervene to support the migration and dispersal of these species. Other adaptation measures with human action include efforts to maintain genetic diversity and to reduce other stressors.
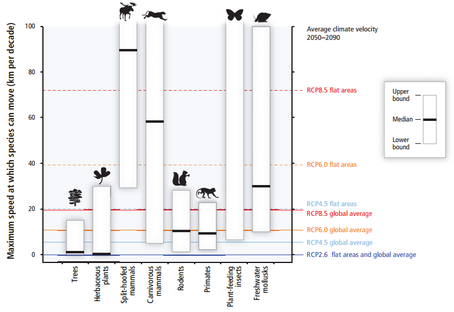
Figure: Maximum speeds at which various groups of species can travel through landscapes (based on observations and models) compared to the rates projected in a rising temperature situation. White boxes with black lines indicate the range (between a upper bound and a lower bound) and the median of the maximum movement speeds that are possible for different groups of species. Human interventions, such as transportation or habitat fragmentation, may increase or significantly decrease travel speed. Designed for different scenarios (called RCP2.6, RCP4.5, RCP6.0 and RCP8.5) and for the period 2050-2090 the horizontal lines show the velocity of climate change to the global average of land areas and for large flat regions. Species with maximum speeds below each line are less likely to be able to move to areas with suitable climate without human intervention (adapted from IPCC, 2014, page 15).
It is also important to stress that adaptation and mitigation measures are complementary, so as to manage and reduce, respectively, the risks of climate change.
References:
IPCC (2014). Summary for policymakers. In: Climate Change 2014: Impacts, Adaptation, and Vulnerability. Part A: Global and Sectoral Aspects. Contribution of Working Group II to the Fifth Assessment Report of the Intergovernmental Panel on Climate Change [Field, C.B., V.R. Barros, D.J. Dokken, K.J. Mach, M.D. Mastrandrea, T.E. Bilir, M. Chatterjee, K.L. Ebi, Y.O. Estrada, R.C. Genova, B. Girma, E.S. Kissel, A.N. Levy, S. MacCracken, P.R. Mastrandrea, and L.L. White (eds.)]. Cambridge and New York: Cambridge University Press, pp. 1-32. Acessed at: https://www.ipcc.ch/pdf/assessment-report/ar5/wg2/ar5_wgII_spm_en.pdf
Santos, F.D. e Miranda, P. (ed.) (2006). Alterações Climáticas em Portugal - Cenários, Impactos e Medidas de Adaptação. Projecto SIAM II. Gradiva, Lisboa. Acessed at: http://siam.fc.ul.pt/siamII_pdf/SIAMII.pdf
what is climate change mitigation?
The term mitigation refers to human action aimed at stabilising atmospheric concentrations of greenhouse gas (GHG) emissions at a level that avoids burdensome and irreversible interference with the climate system.
On the one hand, it involves the reduction or elimination of the emission of these gases, for instance, by replacing the car with cycling when traveling short distances, in order to burn less fossil fuels and, therefore, emit less carbon dioxide (CO2), a well-known GHG, into the atmosphere. Furthermore, by reducing the consumption of meat, even if increasing the consumption of vegetables, emissions into the atmosphere of methane (CH4), another recognisable GHG, are reduced.
Another type of mitigation strategy involves enhancing the capture and storage of GHG in tanks and reservoirs. For example, the protection and renewal of forests contributes to increase the number of plants that perform photosynthesis and, in the process, capture CO2 to produce their organic compounds.

Figure: Examples of mitigation activities (Image Sources: Taras Kalapun; Jennifer; USFS Region 5)
It is noteworthy that no single strategy is enough to stabilise the atmospheric concentrations of GHG. It is desirable that this steady state is reached within a period of time that:
1. allows ecosystems to adapt naturally to climate changes that are already underway,
2. ensures that the world food production is not threatened, and
3. allows to achieve sustainable economic development.
It is also important to stress that adaptation and mitigation measures are complementary, so as to manage and reduce, respectively, the risks of climate change.
References:
IPCC (2014). Summary for Policymakers. In: Climate Change 2014: Mitigation of Climate Change. Contribution of Working Group III to the Fifth Assessment Report of the Intergovernmental Panel on Climate Change [Edenhofer, O., R. Pichs-Madruga, Y. Sokona, E. Farahani, S. Kadner, K. Seyboth, A. Adler, I. Baum, S. Brunner, P. Eickemeier, B. Kriemann, J. Savolainen, S. Schlömer, C. von Stechow, T. Zwickel and J.C. Minx (eds.)]. Cambridge and New York: Cambridge University Press. Accessed: https://www.ipcc.ch/pdf/assessment-report/ar5/wg3/ipcc_wg3_ar5_summary-for-policymakers.pdf
